50% Down in 15 Months
- Rohit Musale, CFA
- Jan 12
- 3 min read

Do you still believe in "Buy & Hold" ?
Key lesson:
Never fall in love with a stock.
Here is a 50% Collapse in Trent.
Stock has gone from INR 8,000+ to below 4,000.
This is the weekly timeframe chart.
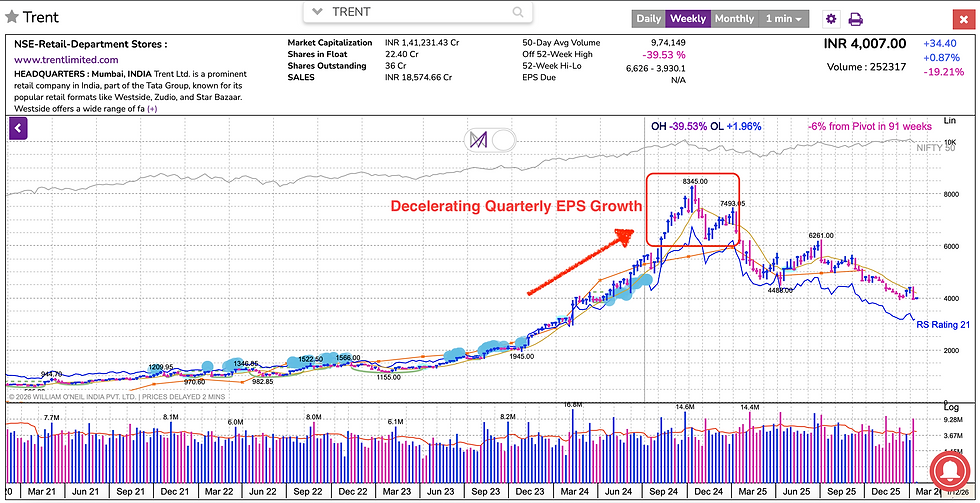
Focus on the red rectangle.
People used to love this stock.
I have heard people say, "This is a lifetime hold."
Look at the latest 3 quarters EPS growth just before it started its downfall.
March 2024 - 1,203%
June 2024 - 126%
September 2024 - 44%
The stock started coming down after October 2024.
Do you notice the deceleration in EPS growth rate ?
44% is not bad.
But, please do not ignore what you see in the numbers.
In William O Neil's CANSLIM system, the C comes first
And
C stands for Current Earnings
C talks about current and latest 3 quarters EPS growth rates.
O' Neil argues that, leading stocks of the past multiple decades had very high rates of quarterly EPS growth.
And
those growth rates were accelerating, not decelerating.
If you are a trader (swing or positional) and if you would have studied O Neil, you would have easily avoided this stock.
Even if you are a value investor, a decelerating trend of EPS growth warrants some attention and investigation.
If you are a value investor and your time horizon itself is 15-20 years, then this discussion is irrelevant for you.
However, if you are a positional or a swing trader, then charts are your game.
Moreover, you cannot ignore the latest fundamental numbers at least.
I am not saying, "Do not buy a stock with decelerating rate of growth of quarterly EPS."
I am saying, "Understand the risk involved with such stocks and size your position accordingly."
I personally check for the 4 pillars of fundamental analysis
- Sales
- EPS
- ROE
- Margins
My decision is based on the combination of the above factors.
My decision is not based on just one factor.
Trent teaches us a very important lesson.
It increases our awareness about quarterly numbers.
One more point:
Always compare a quarter with the same quarter last year.
Example:
Don't compare Sep 2024 with June 2024.
Compare Sep 2024 with Sep 2023.
This eliminates the seasonality factor.
This is exactly what MarketSmith does.
It saves me a lot of time.
Anyways,
coming back to Trent.
Gone are the days of "buy and hold".
We live in the world of "buy and monitor".
Take the time to study my "Orange Trading System".
It will force you to do 5 kinds of analysis before you pull the trigger on a stock
- Liquidity
- Comparative
- Technical
- Fundamental
- Market
The order of analysis also matters.
Notice that, the technicals come before the fundamentals.
Why should I waste my time on a stock that is already trading below the 50 Day SMA ?
Read what Mark Minervini writes in his book.
He says, no matter how great the company is fundamentally, he would not get in unless the technicals are in his favor.
That's a profound approach to stocks.
Saves a lot of headache and trouble.
Trent proves that.
Trent broke the 10 week SMA and 50 Day SMA long long before it continued its downfall.
Regards,
Rohit Musale, CFA
PS: To save tons of your learning time, enroll in my
PPS: Follow me on X: Rohit Musale, CFA